How to Update Spreadsheet Table by ShapeFile Data
« Go Back
Next Chapter »
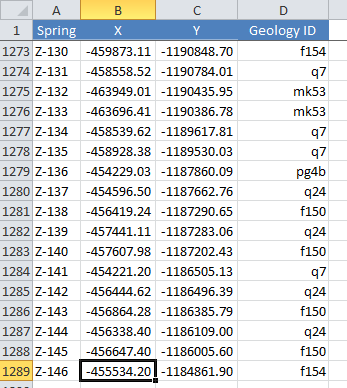
The second function from the GIS to Excel group
enables you to enrich your existing Excel tables
with new data from the Map Layer. An example is
shown in the following Excel table. The table has
a list of springs with their coordinates; you want
to determine the geological unit for all the listed
springs and you have stored all the information on
the geological units in the evaluated area in your
polygon Map Layer.
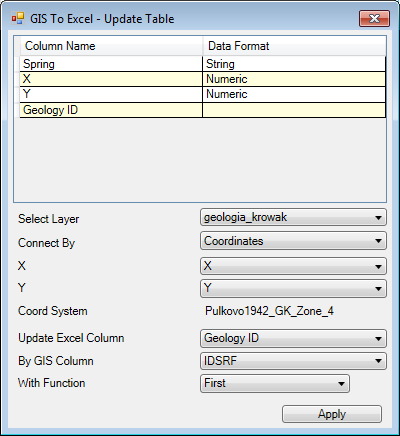
As in previous cases, first you select a table in
the Excel spreadsheet with a column where you want
to insert your geological information. Then you
click on the GIS to Excel – Update Table ribbon
button, and this displays the dialog. Its character
is the same as in the previous cases. The top of
the window has the names of the selected columns
from the Excel spreadsheet and their data format;
and you define all the parameters for function in
the bottom of the window.
In the first combo-box you choose the Map Layer with
all your data. Then, you set the type of connection
between the Excel table and Map layer, and their
parameters. [Update Existing GIS Layer
tells you all about connection options]. In my
example, I connect through the spatial coordinates
of the spring positions. Now, I define the Excel
table column where I want to insert data. In this
case, I can insert data from the map layer attribute
table or from the spatial data. For example, I could
insert the geological unit ID from the attribute
table, or the polygon area, the line length or
whatever I want. Finally, I define the function for
data processing; if I define 1:1 link between the
Excel table and map layer, it is sufficient to use
function First. If I define link 1:N, select the
most appropriate function for your work
(Sum, Average, Maximum).
When you define all settings, click Apply; and add-in
connects the data and updates the Excel table with
your information. In my example, I inserted the
geological units where each spring was located in
the Geology ID column.
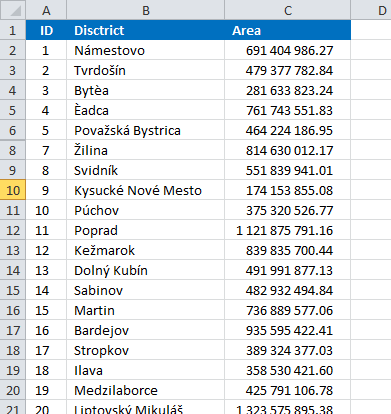
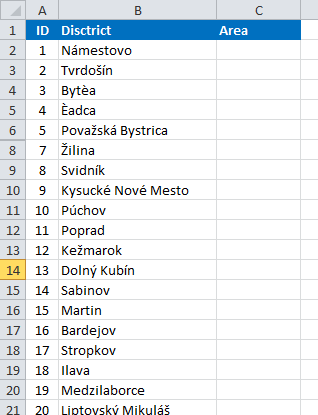
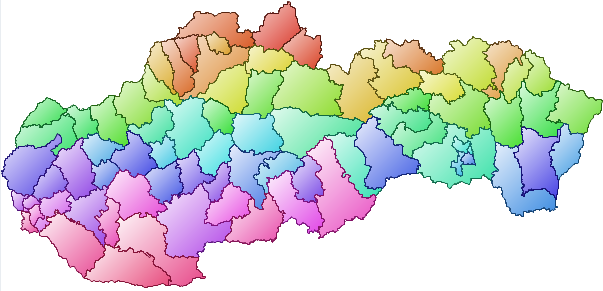
You can understand the Update Excel Table function
by this example. Here, you have a table with a list
of country districts and a map layer of polygons
that spatiallybind the districts. Now you can update
the Area column in your Excel table with area values
for individual districts, as follows;.
|
|
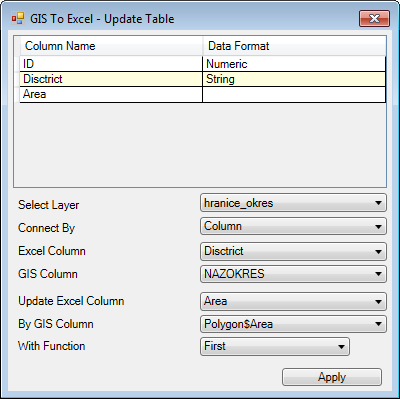
First, select Excel table columns in which you can
operate. Then click on the GIS to Excel – Update
Table ribbon button for the dialog in the next figure;
below. You set the individual parameters in this
window as you did in the previous example. In the
first combo-box, Select the Map Layer with district
polygons. Your Excel table connects with the Map
Layer via columns in the Excel table and the Map
Layer attribute table. You specify that your data
will be entered in the Area Excel table column. In
the By GIS Column combo-box, you select the
Polygon$Area spatial function at the bottom of the
list [Do not select a column from the map layer
attribute table; because if add-in finds a line
with the same district name in the Excel table as
in the Map Layer attribute table, add-in
automatically calculates the district area and this
value will be used.]
Since this is a 1:1 connection – one unique district
occurs in the Excel table and Map Layer only once;
you select "First" in the With Function combo-box.
Then just click Apply and the algorithm starts. The
settings program determines the necessary values
and automatically inserts them in the table. As in
previous cases, if you only want to update part of
the Excel table, use the Filter Excel function to
hide unnecessary rows; and only the visible rows
will be updated.