How to Create Stats in Polygons
Another interesting feature is under the button
Special – Stats in Polygons. Using this feature,
you can create statistical analysis and summaries
from one map layer of polygons to a second layer.
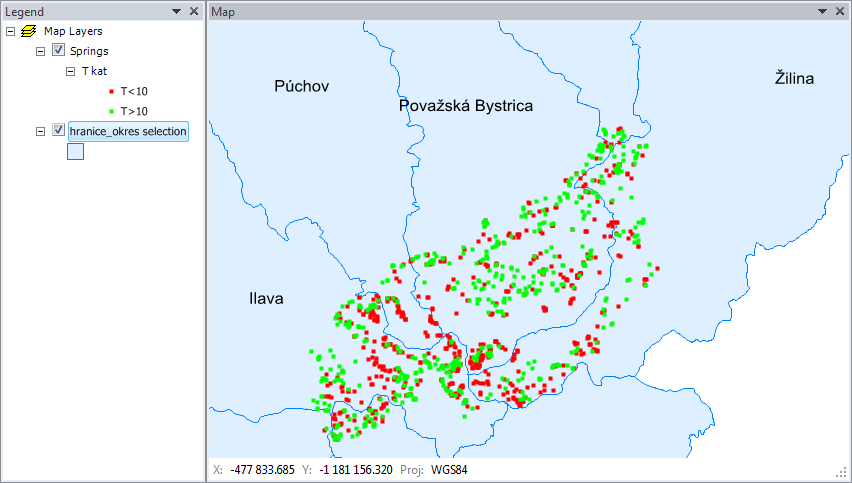
An example is shown in the following figure. One
polygon layer displays districts and the second
contains springs localized in the area of interest
with data stored in the attribute table; such as water
temperature, mineralization or the yield of the
water sources. The column named T_Kat contains
information of the spring’s categorization; either
above or below 10°C; and this parameter sets all
points in the Map Panel in the appropriate color
for < 10 °C and > 10 °C.
You can use Special – Stats in Polygons for the
following imagined function. Imagine you want to
find the summary of yields for all springs in
individual districts, and want to calculate this
sum individually for springs with temperature <
10 °C and springs with temperature > 10 °C. Now
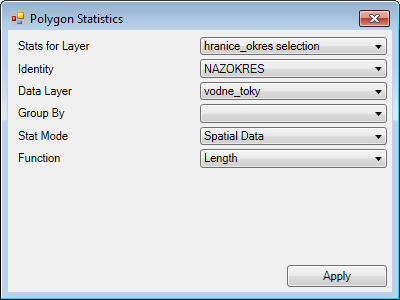
click Special – Stats in Polygons to display the
following dialog.
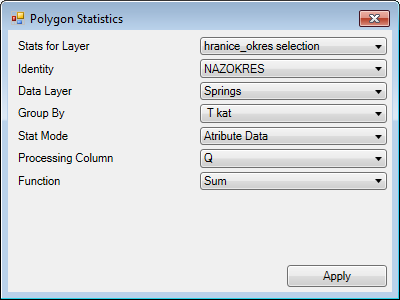
Here, you define your parameters. First choose the
Stats for Layer that contains district polygons which
delineate the areas. Then define the column from
the attribute table that indentifies the individual
districts, such as the name of the district. Choose
the layer you want to calculate your statistics from
in Data Layer. In this example springs are stored
in the layer named "Springs". If you want to
calculate the yield statistics for all the springs
in the district, leave the Group By combo-box empty.
But, if you want to calculate the sum of yields
individually for the < 10 °C and > 10 °C, put T_kat
in the Group By combo-box.
In the Stat Mode combo-box you have a choice
"Attribute Data" or "Spatial Data". If you want
to calculate statistics based on the data stored
in attribute table, select the Attribute Data
option; and then select the column you want to
use for statistics in the Processing Column
combo-box. In this imaginary case, spring yields
are stored in column Q. Finally, select the
processing function. Next, choose the Sum function
because you want the summary yield. After defining
all these parameters, click Apply and addin will
compute your stastistical parameters. If you have
a lot of data in the layers, this may take longer
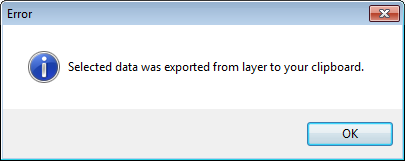
to process. The next message box informs you that
your statistics results will be saved to the
clipboard; and you can paste the result into the
spreadsheet using the Ctrl+V command.
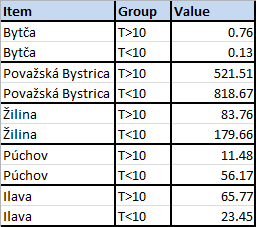
The example result is shown in the figure below.
The Item column contains your district names which
identify your polygons. When you define the Group By
combo-box, the Group identification is listed in
the next column. Finally, the selected statistical
parameter is in the last column under Value. The
following example automatically counted the springs
yields in individual districts and individually summed values for springs with temperatures above and below 10°C.
The next example for your statistical analyses uses
the spatial characteristics of layer features and
the same district polygons (instead of values from
the attribute table layer used in the previous
example). The statistical parameters are computed
from the line layer that defines the area’s river
network.
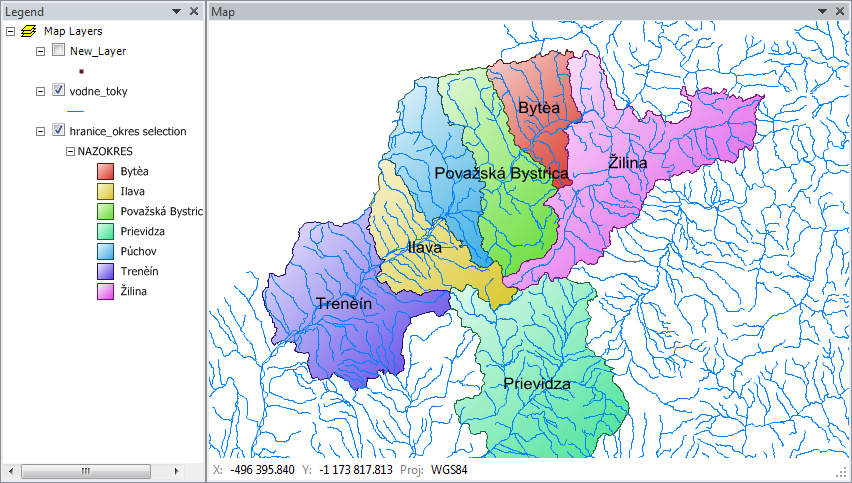
Your imagined task here is to calculate the lengths
of all rivers and streams in individual districts.
Select the layer for computing vodne_toky
(= "water-flows") in the Data Layer combo-box for
your river network. There are no "groups of rivers"
so leave the Group By combo-box empty. Select the
Spatial Data item in the Stat Mode combo-box which
enables you to calculate the spatial characteristics
directly from individual features. Then choose the
Length item in the Function combo-box, and this
automatically detects the length of each feature
in your polygons. Finally click Apply, and add-in
calculates the desired river/stream length values
and save them to the clipboard.
Pressing Ctrl+V keys then pastes the following table to the Excel spreadsheet.
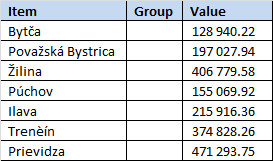
The Item column lists your districts. The Group
column remains empty, and the last column contains
the summary length of rivers and streams in each
district. Be careful of the coordinate system you
used here; because if you used WGS84, the length
values are in degrees, and the metric coordinate
system gives the lengths in meters. This described
spatial analysis can be performed on lines, points
and polygons; and you can calculate lengths,
centroid coordinates, areas and the total number
of features in the defined polygons.