The GIS.XL ribbon toolbar tab looks like in the previous version and only few new items have been added.
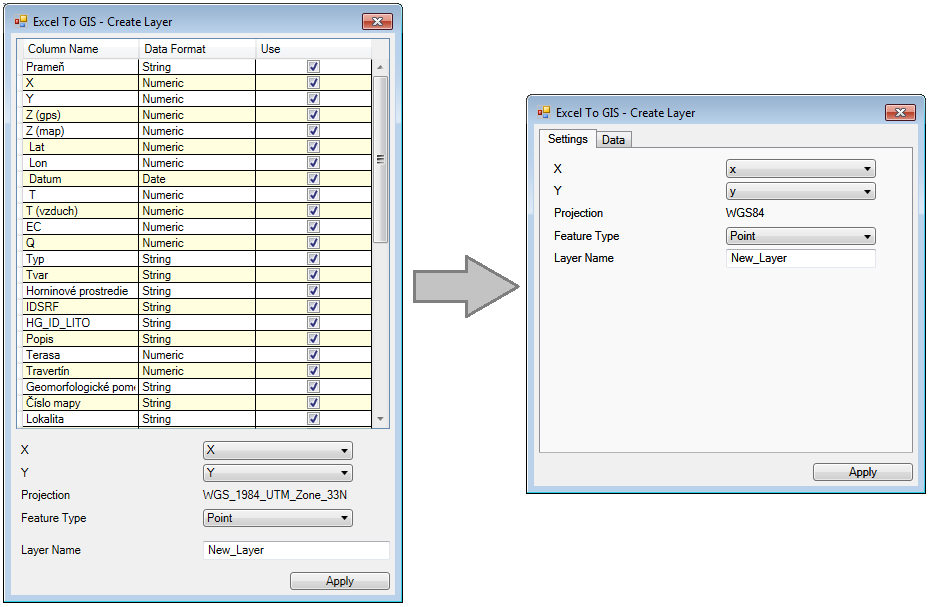
Most were updated (visually) individual dialogs that have been simplified. The original dialog interface was divided into two tabs. Important settings are located in the first tab and additional information are now in the second tab – Data.
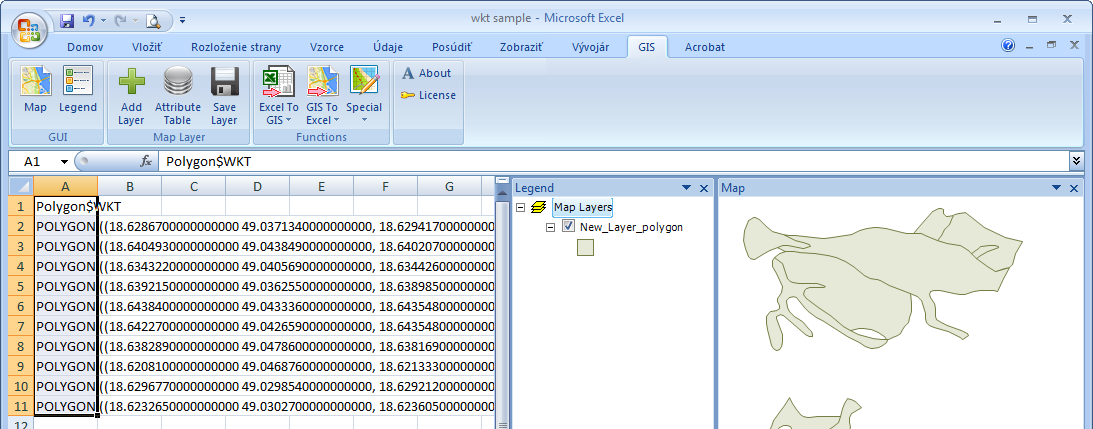
In the previous version, new shapefiles were created from coordinates stored in two individual spreadsheet columns. Currently, the program allows you to create a shapefile from geometries that are stored in one spreadsheet column – in the WKT format. Supported WKT geometries that you can use in the GIS.XL are point, linestring, polygon and polygon with holes.
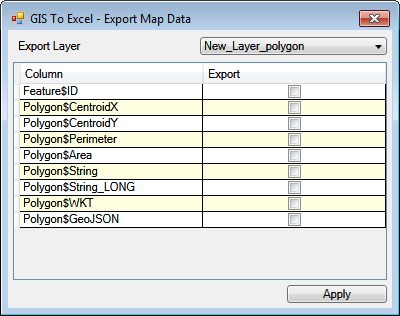
For shapefile export (function GIS to Excel), the program allows you to create new variables such as the geometry in WKT or GeoJSON format. Additionally, the data export from shapefile was fundamentally redesigned. Now, the export of large shapefiles is sometimes up to 1,000 times faster than in the previous version. At present, it is possible to export data from more than 1 million shapefile features at once.
Well-known functions Stats in Polygons and Create Buffer were also accelerated and updated. A major update was applied on the Export to KML function. In GIS.XL 2.0, you can export geometries from several map layers into a single KML file, and the program supports correct export of polygons with holes. The add-in automatically exports geometries and visual properties of features, such as fill color or line thickness. It is also possible to set whether you want to export data from the shapefile attribute table.
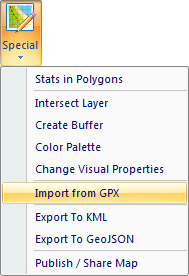
An interesting new feature is direct data import from GPX files (waypoints and trackpoints). Selected map layers in the Map Panel you can (using another new function) export to a GeoJSON file and in addition, it is possible to setup whether the geometry only will be exported or also actual visual properties and data from the attribute table.
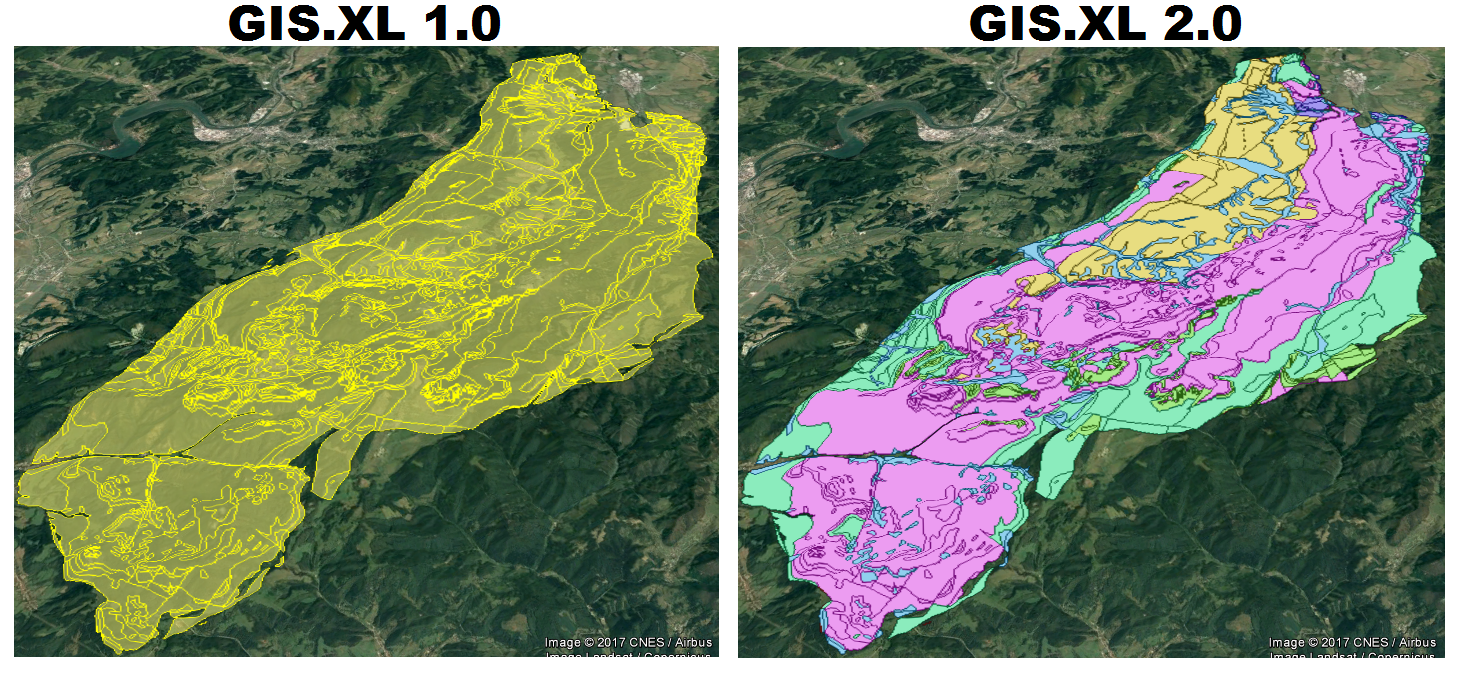
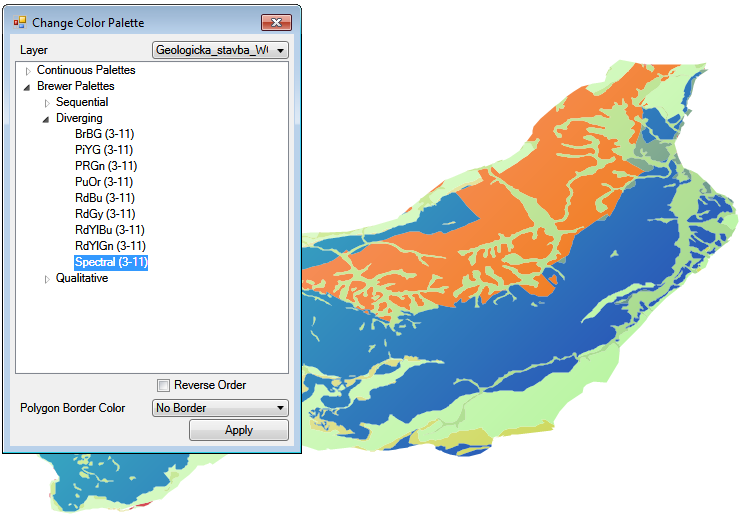
In the previous version, we could divide the map layer features into groups and display them in different colors from the basic color palette. In the current version, the program allows you to apply dozens of new color palettes to the created map layer categories. You can use continuous color palettes or special set of palettes – Color Brewer for categorical data.
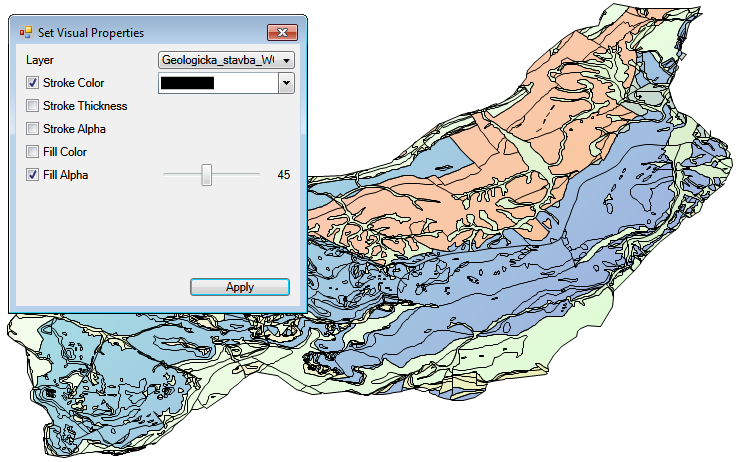
A new is the Set Visual Properties feature, which allows you to set up an individual selected property at once for all features in layer or categories such as transparency or fill color.
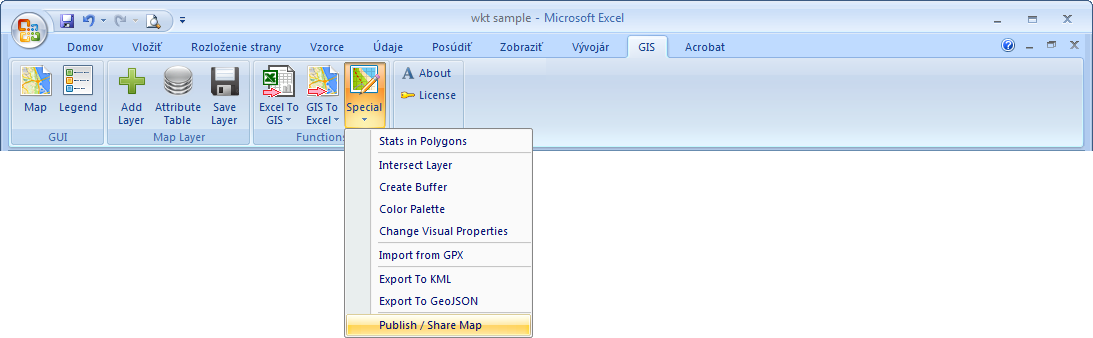
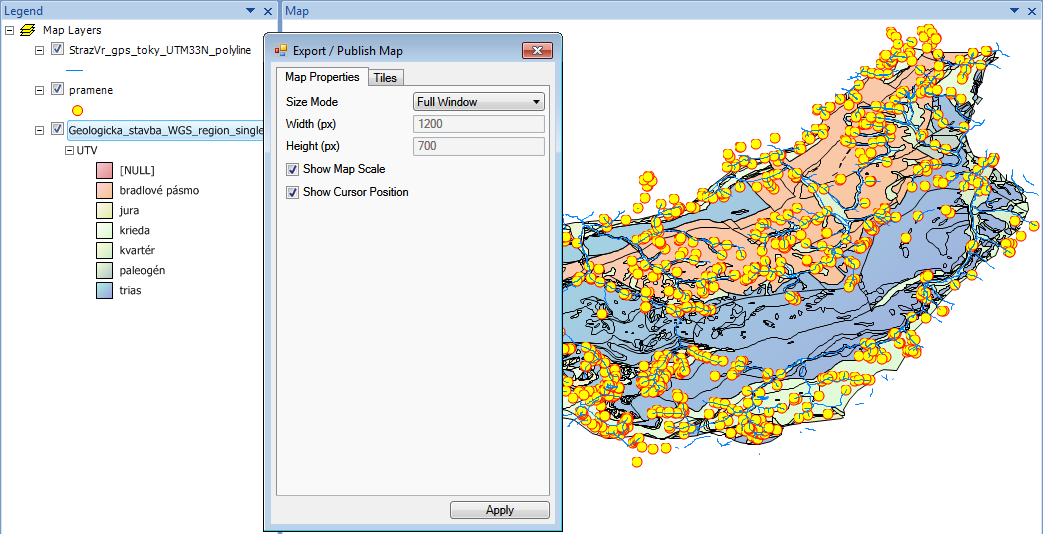
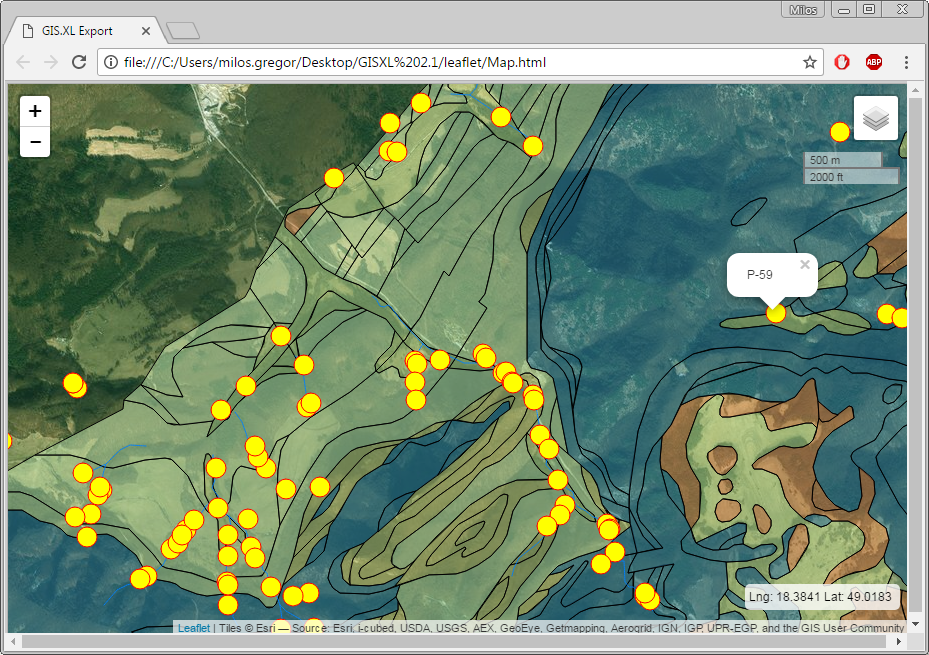
The last and perhaps the most interesting feature is the Publish / Share Map. If you need to export or share your map out of the add-in environment (in the vector format), you can use this feature. Using the dialog, you can setup and create a html document that you can display in any browser. This html document contains a zoomable map that is created using an open source technology – leaflet.js library. In this document, you can display selected map layers from the add-in in identical visual form (geometry, visual properties and also data from the attribute table). You can display these vector layers on the base maps from several online providers (e.g. OpenStreetMaps, ESRI, CartoDB, Stamen). Created html document you can use in "offline mode", or you can paste it to your website.
Other smaller add-in updates will be described step by step in following posts. New version of the GIS.XL add-in is ready and will soon be available for download.