How to Publish / Share GIS.XL Map
Another important feature of GIS.XL add-in is the Publish / Share Map.
This feature exists since 2.0 version. Its purpose is to publish and
share your maps created in GIS.XL, either online and offline. The
generated result is one HTML document that you can add on your site
or email to another person. The resulting map is in vector format and
supported coordinate system is WGS-84.
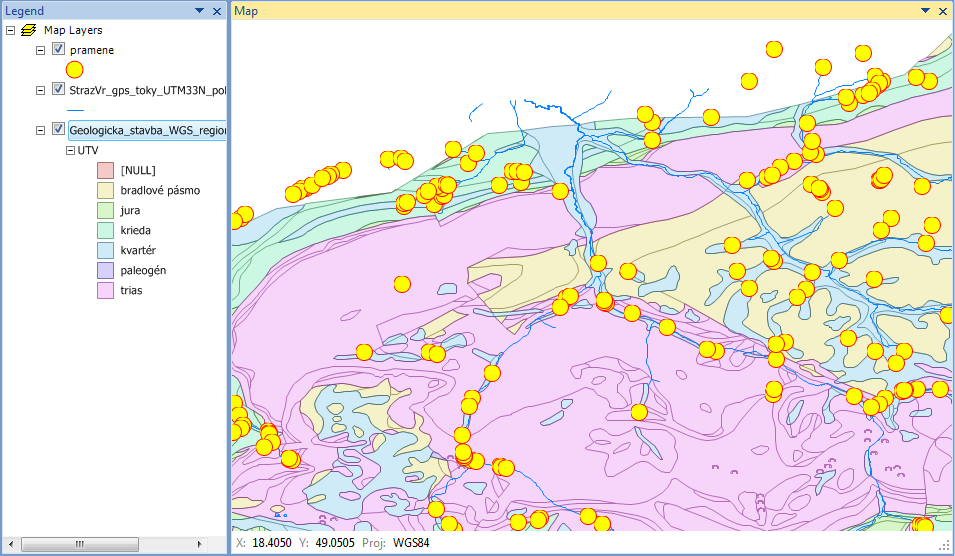
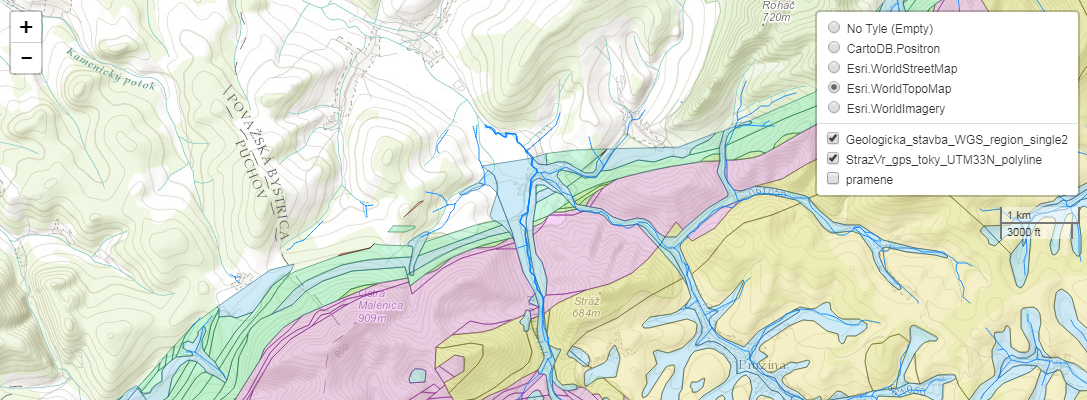
We’ll show the functionality on the following example. In the map
panel are loaded three map layers. Points show the springs, blue
lines represent rivers and colored polygons represent the geological
structure. Map layers are displayed in the WGS-84 coordinate system.
We want to export these map layers from the GIS.XL add-in to the HTML
document.
Export is defined by clicking the item Special – Publish / Share Map.
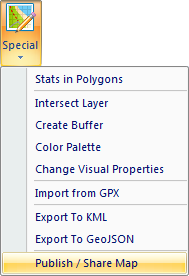
Displayed help dialog defines the export. Only visible map layers
are included into the final document. The help dialog contains only
two tabs. In the first – Map Properties you define the basic
properties of the resulting vector map.
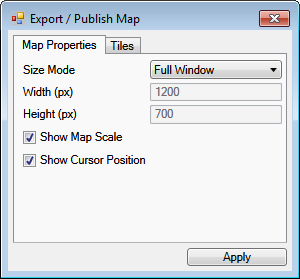
Using the first combo-box you define whether you want to display
the map in full screen mode (Full Window), or its size will be
exactly defined using the following two text-boxes (Width & Height)
in pixels. Finally, using the last two check-boxes, you can set
whether you want to display the map scale and mouse cursor coordinates.
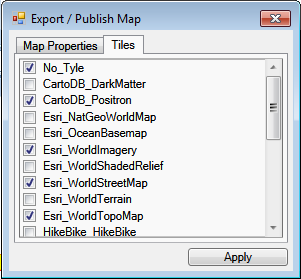
If you have all the parameters set, you can go to the second tab –
Tiles. If you use the WGS-84 coordinate system (in the Map Panel),
you can display in the background maps from selected online map
providers. You can use several providers in one HTML document and
interactively switch between them. However, I recommend using as
few providers as possible in one document, because its rendering
slows the interactivity of the resulting map.
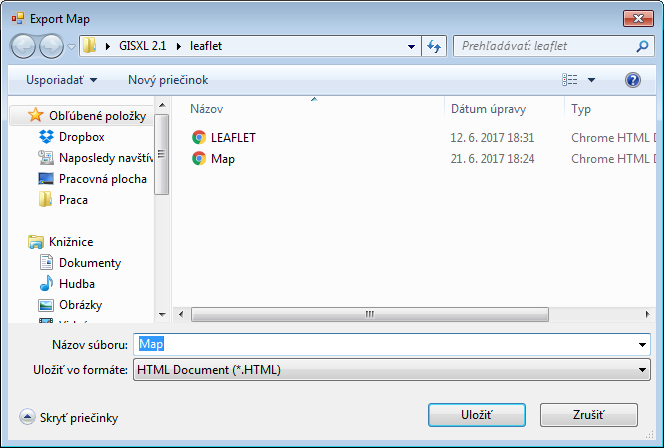
If you have one or more map providers selected, click the Apply
button and set the filename / directory for HTML document publishing.
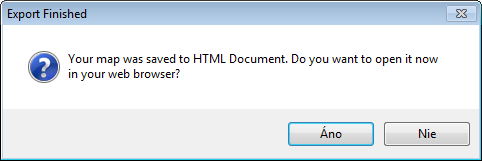
After saving, a HTML document will be created. After saving,
published document can be viewed on any web browser / platform
that support JavaScript. The user is informed by the message-box
when the export is finished and created document can be opened
immediately by pressing the Yes button.
The result looks like in the following figure. We created the
map as Full Screen and on the background are displayed tiles of
the online map provider. Map supports interactive features like
zoom and pan. Selected vector layers from the GIS.XL add-in are
displayed on the map tiles.
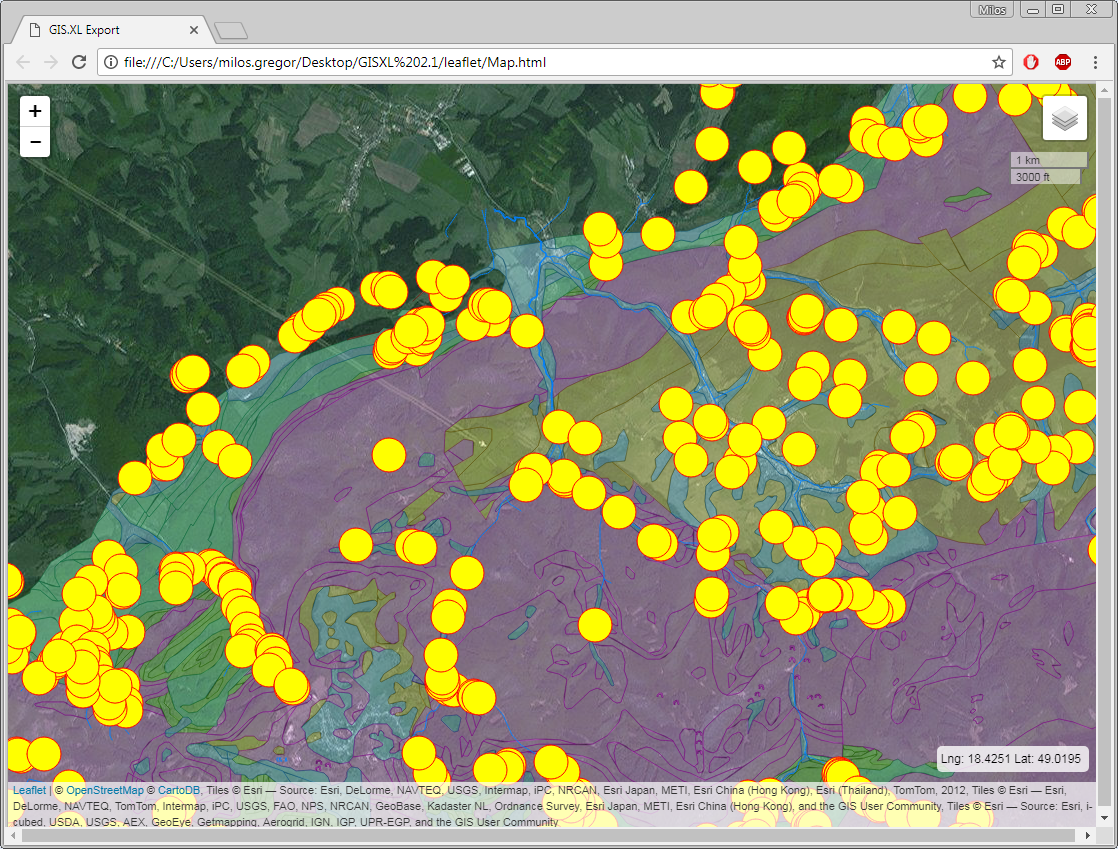
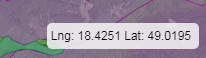
In the lower right corner is small panel that displays the coordinates of mouse cursor.
In the upper right corner are displayed map scale and a button
that allows you to set the map interactively. If you click on
this button, you will see the menu of background map providers
that you can switch (option-buttons). It is also possible to
show / hide your vector map layers using the check-boxes.
If you click on the selected vector object, you will not see any
information from the attribute tables (like in the case of KML export).
This feature is defined in a special way. Popup window is possible to
create if you have in the attribute table a column named “popup”. If
program finds this column, automatically creates popup dialogs (for
selected layer) and the content of this variable is inserted as its
content. It can be a number, text or more complex content. Since the
export result is a HTML document, you can insert into popup dialog
custom content in HTML form. More complex examples will appear in a
separate blog post. In the following example, we’ll display as the
popup content only a simple text string that will contain the spring
identifier. An example of a modified attribute table is shown in the
following figure.
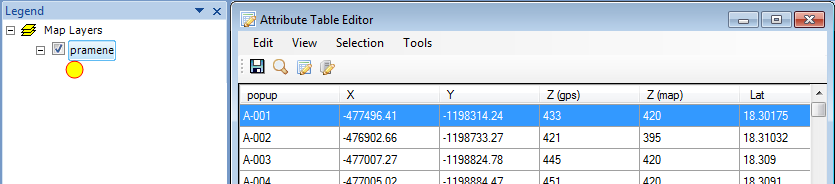
The attribute table now contains a column named popup and this column
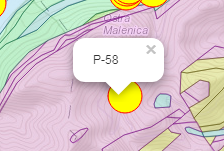
contains a spring identifier – for example “A-001”. If we export the
map again as an HTML document, the program automatically finds the popup
variable in the attribute table and creates individual popup dialogs
for each spring. The example is shown in the following figure. If you
click on the selected point, the information in the popup-box will be
displayed. In our example, this is just a plain text. But the program
allows you to insert any content in HMLT format, e.g. table, link,
graph or image.
I need to remember one thing. While the export is between very different
technologies, the export may not always be absolutely identical and
exported are only visual properties that are supported by both
technologies. These are, for example, the line thickness, transparency
or color. Points are always (in the current version) in the form of
circles, which adopt the fill color, border color, transparency,
border thickness and circle size.
The full functionality of the generated HTML document is more
apparent from the video tutorial. Other examples are / will be
listed in separate blog posts. The created document is just one
file that you can send as an email attachment to others. You can
also paste the HTML source code into your website and share the
result online. Here, the basic knowledge of html code will be required.