GIS Features of GIS.XL Add-in
GIS interface functionality is mostly controlled by the first five
buttons in the ribbon toolbar. As discussed in the previous chapter,
the first two buttons display the Map and Legend panels.
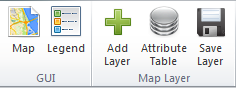
Another button, named the Add Layer, allows you to insert layers stored
on your hard disk into the map. These map layers can be in vector or raster
formats. Lines or polygons stored in ESRI ShapeFiles (*.shp) can be inserted
into the map points under the vector format.
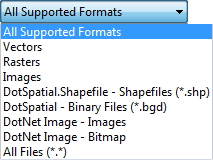
You can import images or rasters (grids) from raster formats. As example is
DEM—the digital elevation model. The current version of Add-in only lets you
work with rasters stored as "Binary Grids" (*.bgd). If you have rasters in
another format, you must convert it in other software. For example, I use the
SAGA open source tool.
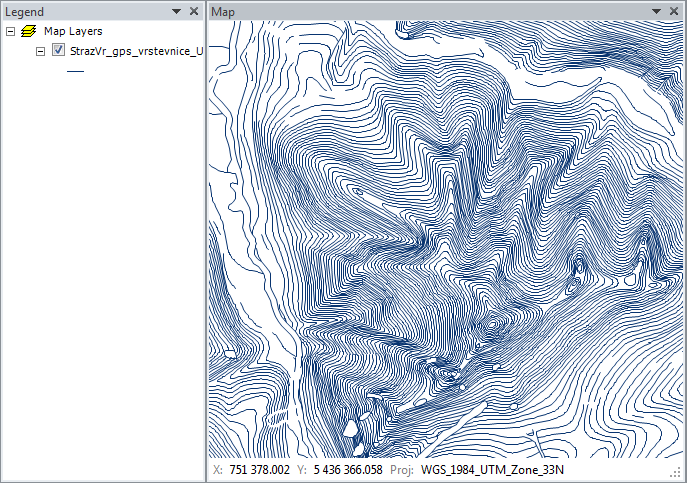
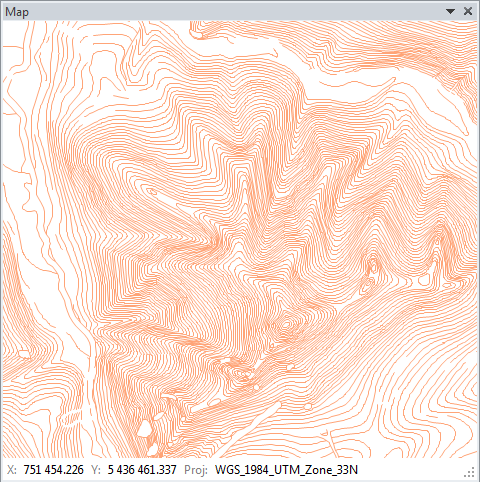
The next image shows an example of elevation lines imported from a ShapeFile.
The new layer is displayed in a single color when you import it. In addition
to the Map panel, there is also a Legend panel (where one item has been added
for display purpose). The Legend panel lets you change the position of individual
layers using drag-&-drop features.
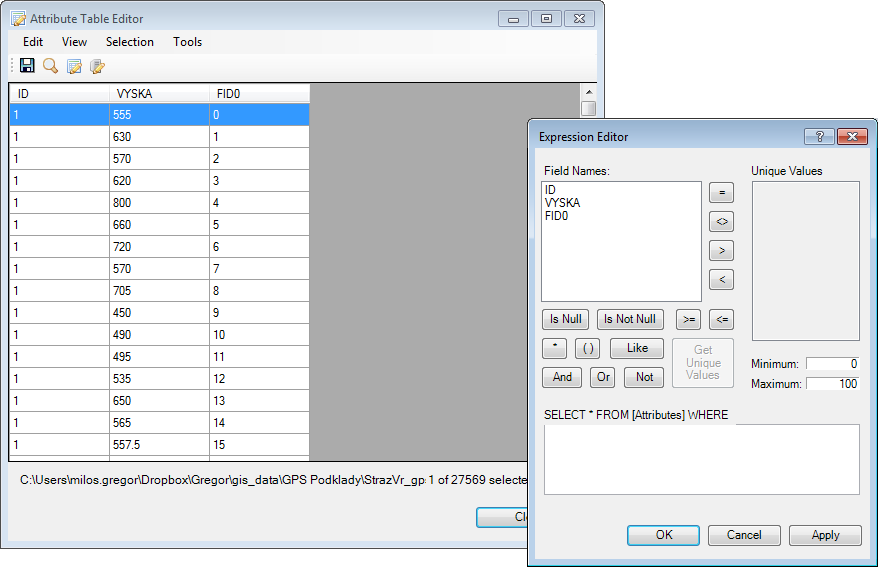
If you select one layer in Legend and then click on the Attribute Table
button in the ribbon toolbar, a window displays data from the ShapeFile
attribute table. You can select, filter or edit this data in different ways.
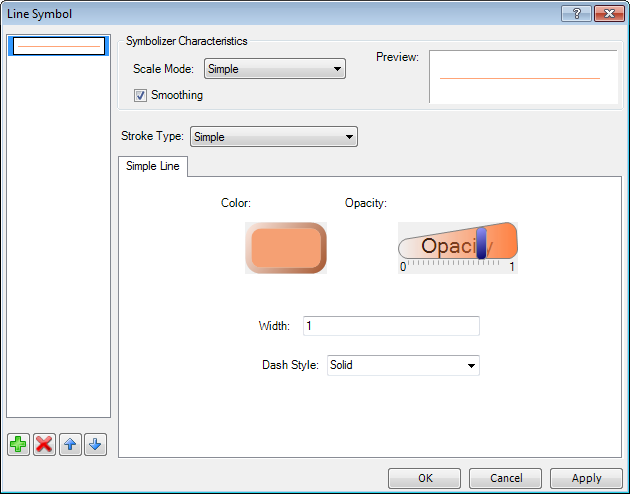
If you want to edit the visual properties of the map layer, use the functions
in the Leged panel. In the example, I have opened the elevation lines. When
you double-click on an item in Legend, a dialog appears where you can edit
visual properties of all the features in the layer. In the following example,
I changed the line color and opacity.
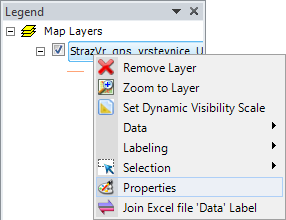
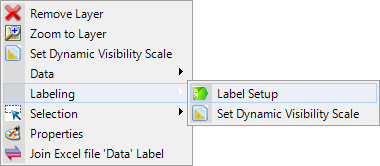
Additional visual features can be set by right-clicking an item in the Legend panel.
A context menu is displayed and you can choose your option. For example,
you can use this to remove layers from the map, zoom to the entire layer
extent, export layer attribute data or set feature labels. Comprehensive
setup options for layer properties can be found under the Properties menu item.
If you want to display labels for elevation lines, click on the Labeling –
Label Setup item in the context menu. You will see a dialog where you can
set labels for the map layer. You can also enter values stored in the ShapeFile
Attribute Table as labels.
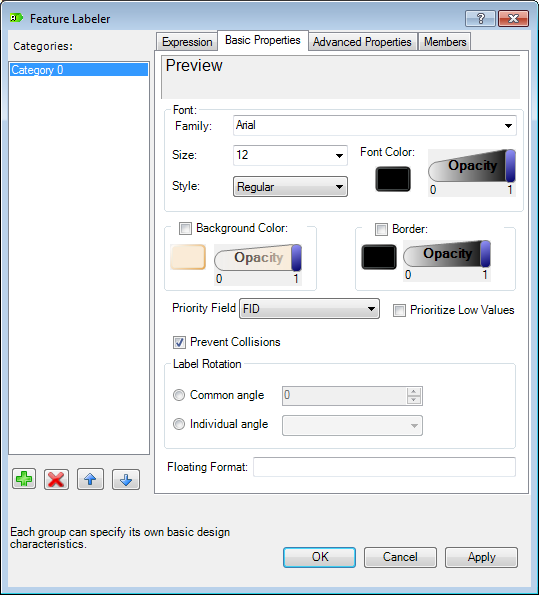
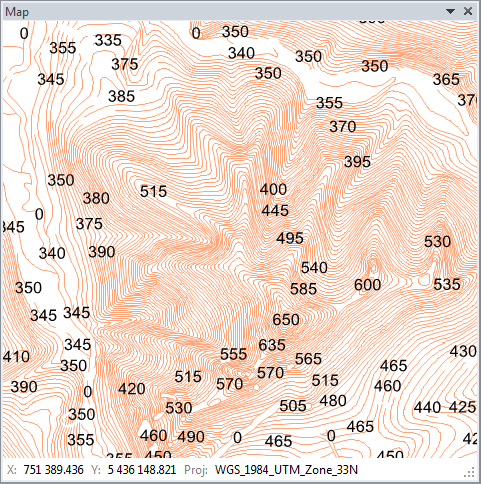
You can also set a number of parameters for your labels; such as font,
size, transparency, rotation and other things you want to use. An example
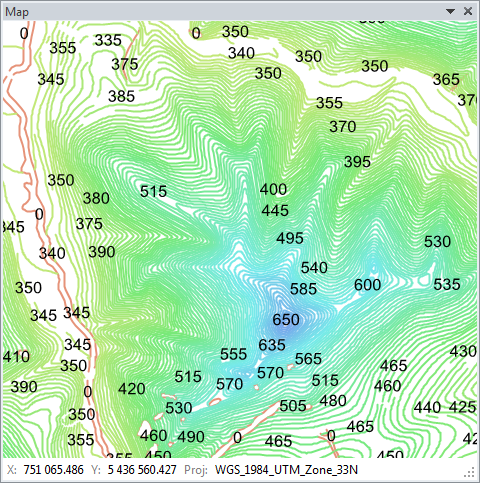
of displayed labels is shown in the following image.
In addition to labels, you can also set visual characteristics of each
feature (line) in the map layer according to the attribute table data.
When you click on the Properties item, a dialog appears where you can
set-up multiple features, such as symbols.
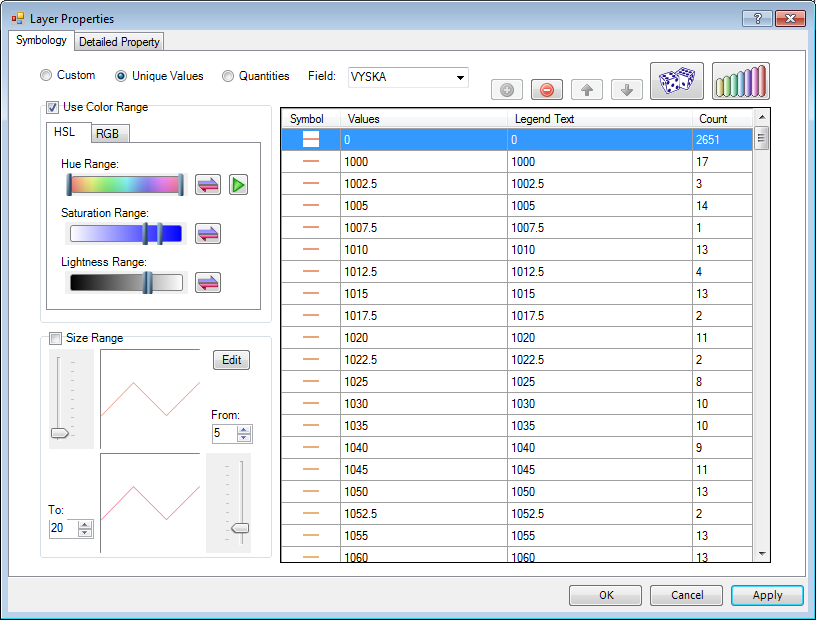
In the example below, we set line colors related to the "VYSKA" column
in the attribute table (vyska = altitude in English). The map is much
easier to read when you use this set-up, and you can set multiple parameters
of map layers until your requirements are completed.
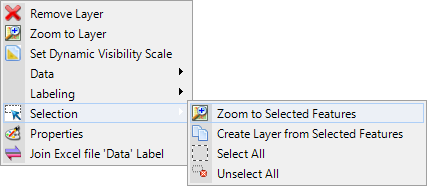
Other GIS functions can be found by right-clicking on the Map Layers root
item in the Legend. A context menu displays the following additional features.
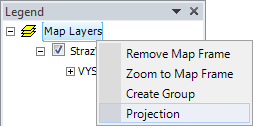
These features let you zoom the map to the maximum extent; or you can
create groups of map layers. One of the most important feature is the
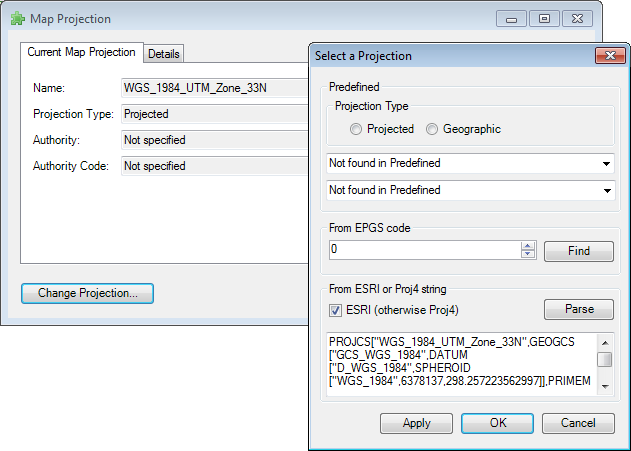
last item – Projection. Click on this and you can either display information
about the map projection you have used, or you can change it. This feature
is particularly important if you want to use the function for data export
into Google Earth (Excel to KML). You need to use projection WGS84 for this function, and
this is explained in detail in later chapter.
The last group of functions is contained in the Map panel context menu.
You right-click on the map, and a group of functions is displayed in the menu.
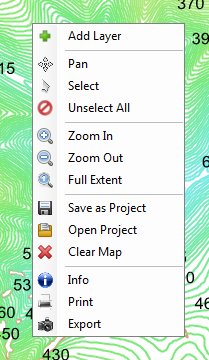
The Add Layer function lets you add new layers to the map from your computer
disk. The Pan function allows you to scroll the map with your mouse. The Select
option gives you the opportunity to select individual features from the map
layer and Zoom and Full Extent functions scale the map. The Open Project and
Save as Project options open and store information about current maps layer
setups and properties. If you often open the same map layers with the same
visual characteristics, you can save these proerpties together and automatically
open them in bulk. This simplifies and speeds up your work. The Clear Map function
removes all layers from both the Map and the Legend panel.
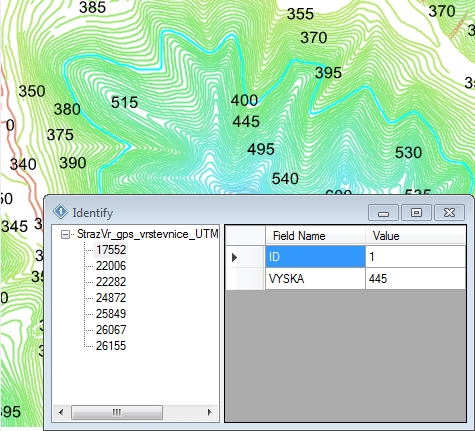
The last three features are the most interesting; the Info function activates
your options to idenfity each feature on the map. Click on the map and an auxiliary
dialog appears with all the data in the attribute table for the features you clicked.
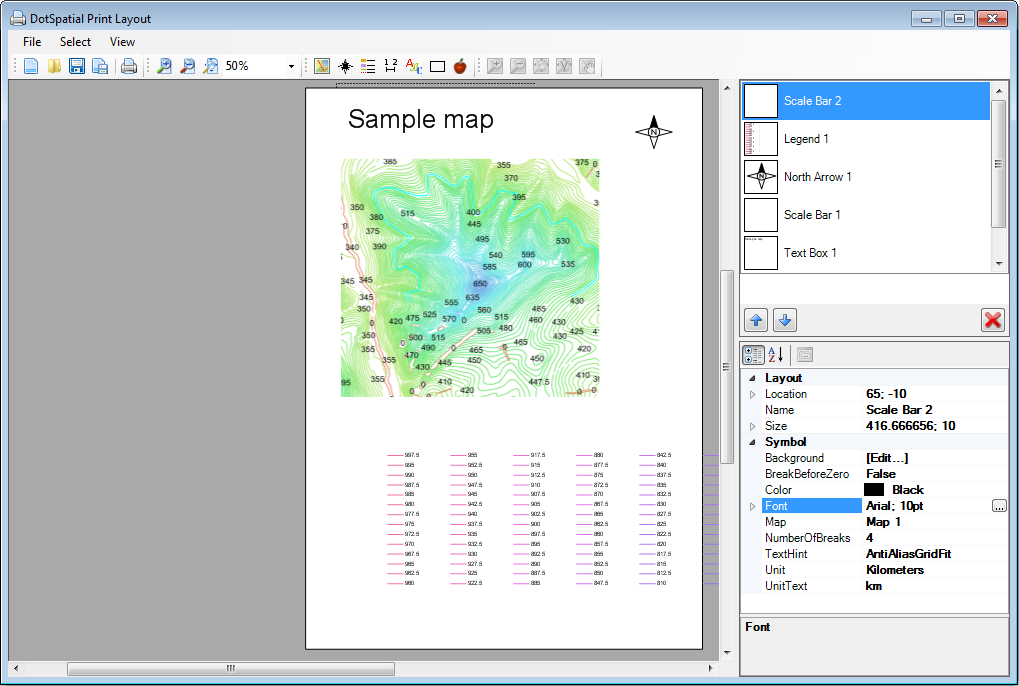
The penultimate function Print lets you print your map results easily in map
sheet form. Your map will be inserted in the Map panel of your printed map.
You can then add things on the paper. For example, you can insert the things
you need including the legend, a north arrow, the scale and labels and custom
images (logos) from your disk. Finally, you export your finished map as an
image file.
However, if you don’t want to print, and only want to export your map from
the Map panel, click on Export – the last item in the context menu. This
saves your Map panel content in an image file.