How to Create New ShapeFile Layer
You can create a new map layer from selected data in your spreadsheet. Just click the Excel to GIS – Create New Layer button in the ribbon toolbar.
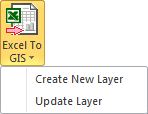
This displays the following dialog.
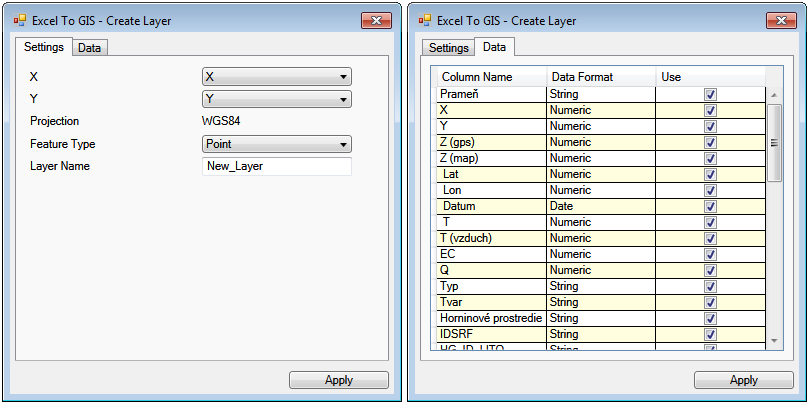
This dialog has two main parts - tabs. The second tab contains definition table describing the selected data. The first column displays the column names in the selection, and the second defines the data format in the individual columns. At this point, you can immediately see whether your data is correctly formatted.
For example, if you have string values instead of numeric values in columns that include coordinates, you see this fact directly. The map attribute layer is also created from the selection, and the last column of the table defines whether the selection column is to be inserted in the resultant ShapeFile attribute table.
The properties in first tab enables you to define the character of your new map layer. Although the basic settings for all types of features are identical, this dialog area changes depending on what type of feature you want to create.
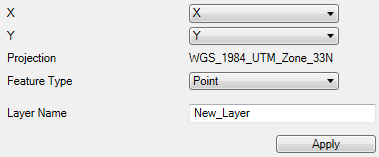
First, you set-up columns that contain numerical values of your X and Y coordinate in the first two combo-boxes. The coordinate system you used in your new ShapeFile is displayed in the next column. The coordinate system will always be the same as you defined in your map panel; but this row only has control purpose and it is not possible to change the coordinate system. You can change the coordinate system by using the Legend panel context menu features.
You then select the type of map features you want to create from the next combo-box. This version of add-in gives you the choice of 8 types of features you can create from Excel data. However, the next settings in the dialog change when you change the feature type. Finally, you define the new map layer name in the last line.
When you have defined all parameters, you click Apply and the program automatically creates your new map layer from Excel data; exactly according to your chosen settings.
The following subchapters describe the options and settings for generating individual types of map layers.
Create Point Layer
The basic type of map layer you can create is composed of points. To use points, you choose
the Point option in the Feature Type combo-box. If you choose Point, you cannot define any
other parameter, and a single line in the selected table defines one point in the map layer.
If you want to create a new layer in add-in, you must remember
one thing. Columns that contain X and Y coordinate values must
not have any empty cells. If you have rows without coordinates
in your table, hide them using Filter or remove them. An example
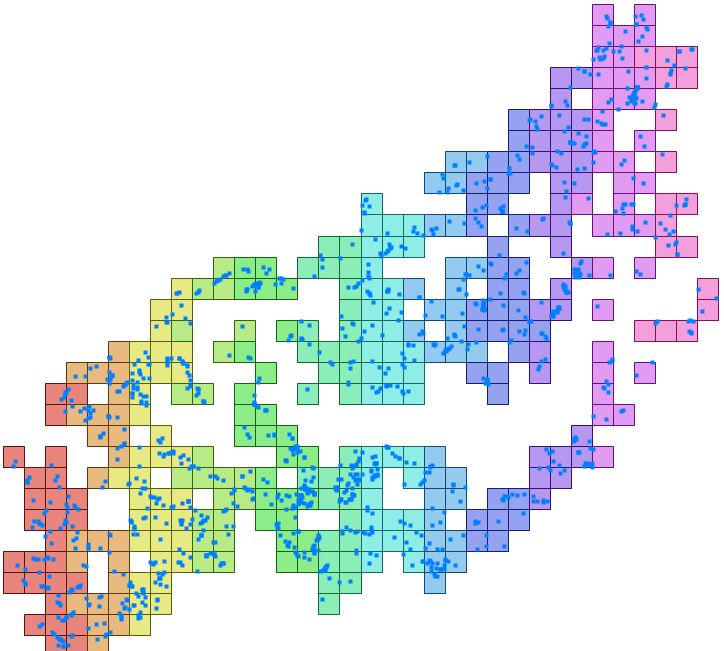
of a new created point layer is shown in the following figure.
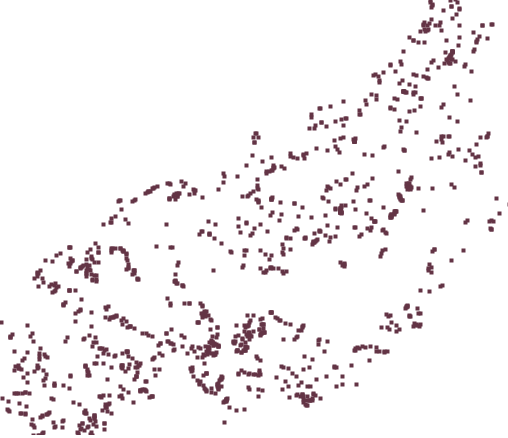
This new map layer is formed by simple points. You can change
their visual character by substituting values stored in your
Map Layer attribute table.
Create Line Layer
The next simple feature you can create with add-in is lines. As
in the previous case, your coordinates are defined in the X and
Y combo-boxes.
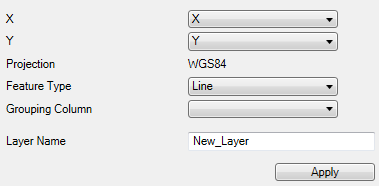
When you choose the Line option in the Feature Type
combo-box, the Grouping Column parameter is displayed. If
you leave this combo-box empty, a one-line map layer will be
created from the table. If you want to create multiple lines in
a single layer, you must have a column in the table that separates
each line. This column will contain your defined values. When the
value in this column is changed, it begins to create a new line,
and the points in the current line are inserted in the new line
unless the value in the column changes. Attribute table values
are always created for the first record for a given line in the
table. An example of table structure with two lines to be given
values is as follows.
| X Coordinate |
Y Coordinate |
Grouping Column |
Attribute data_1 |
Attribute data_2 |
| 23.7 |
12.3 |
Line_1 |
value |
value |
| 23.4 |
15.4 |
Line_1 |
|
|
| 25.6 |
11.2 |
Line_1 |
|
|
| 43.3 |
5.6 |
Line_2 |
value |
value |
| 54.2 |
5.9 |
Line_2 |
|
|
| 55.8 |
12.4 |
Line_2 |
|
|
| 94.5 |
22.5 |
Line_2 |
|
|
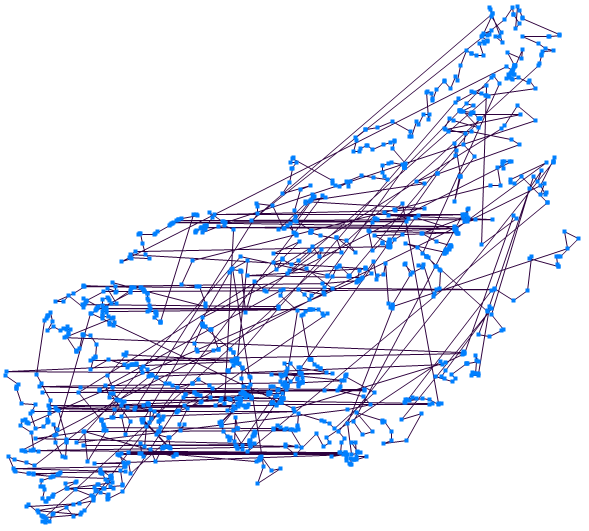
The two lines, Line_1 and Line_2 in the Grouping Column, in the
above table have defined coordinates. Coordinates are stored in
the first two columns and the breakdown of each line is defined
in the third column. Finally, the last two columns have data
used for generating the attribute table layer. A generated line
layer example is in the next figure.
Crete Polygon Layer
Another type of vector map you can create is a polygon layer. Its definition is the same as for the line layer.
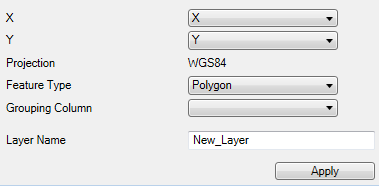
Polygon vertex coordinates are defined by the first two combo
boxes. You can create multiple polygons from the table using
the Grouping Column parameter; -exactly the same way you did
for lines. Again, if you leave this combo-box empty, only one
polygon will be created from selected data.The created polygon
layer example is shown in the next figure.
Polygon attribute data is created from the first line of your selected Excel spreadsheet; the same as for lines
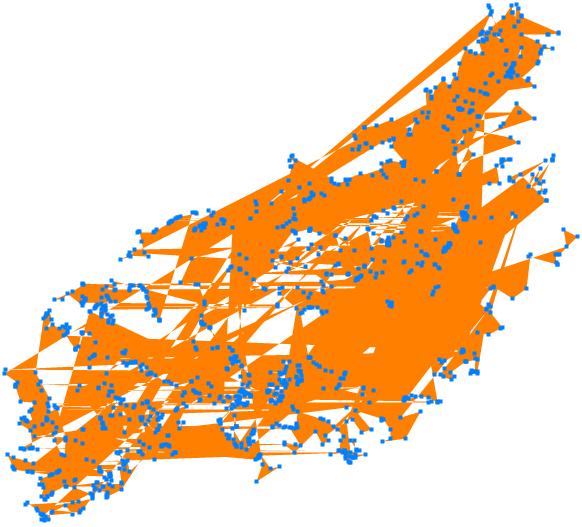
Create Convex Hull Layer
Another feature you can create is a convex hull polygon layer.
This encloses all coordinates from your Excel spreadsheet in a
single polygon. No additional option or parameter setup is required
for this map feature.
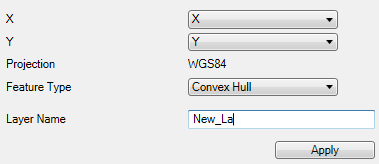
An example of the convex hull layer is shown in the next figure.
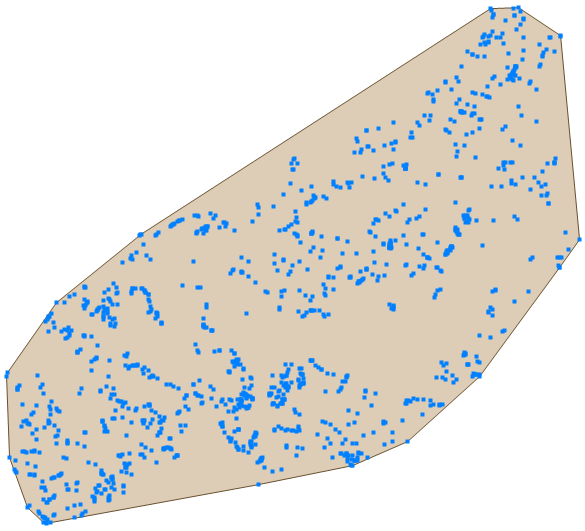
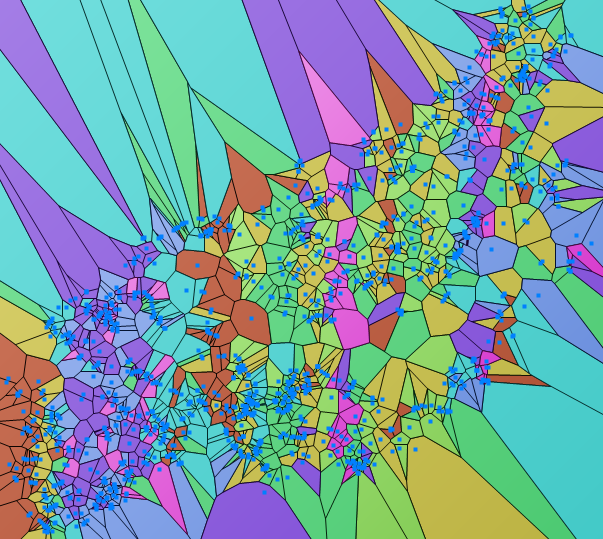
Create Layer of Delaunay Polygons
Delaunay polygons can also be created from your data.
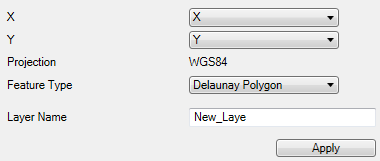
You do not have to define any parameters when you create Delaunay polygons and the result looks like the following figure.
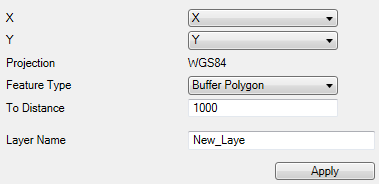
Create Buffer Polygons
The last feature type you can create with add-in are buffer polygons.
If you choose this type, it is necessary to set the distance at which
are polygons created. The values used for this distance are the same
as you use for tiles; and are always defined in the same units as your
coordinates. Therefore when you use the metric coordinate system, your
values are in meters and when you use the WGS84 coordinate system your
values are in degrees.
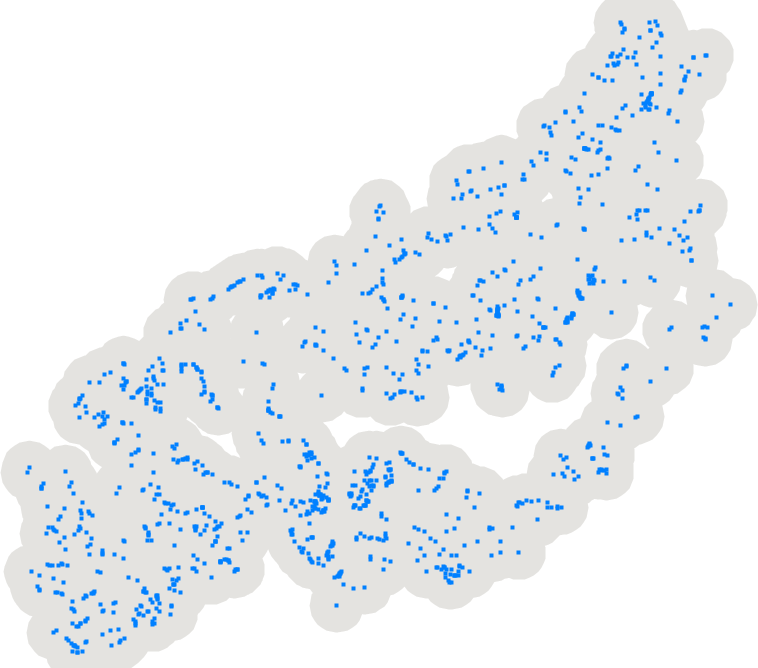
When you have defined your buffer distance, click Apply, and
add-in will generate a new map layer as in the following figure.
The buffer is generated for each individual record (point) from
your Excel spreadsheet.
Create Layer of Hexagonal Polygons
The next polygon type you can create from Excel data is called
hexagon bins. These polygons statistically summarize values in
selected areas. Three configurable parameters are displayed when
you select hexagon bins in the Feature Type combo-box.
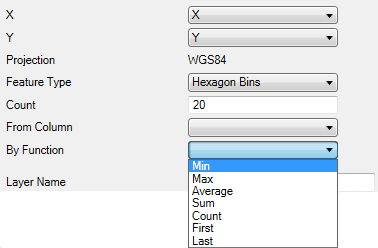
Explanation: First, you set the Count parameter. This
defines the minimum number of poylgons in a row or column. If
the coordinate range is smaller on the x-axis, this parameter
will be applied to polygons rows. If the range of scale values
is smaller on the y-axis, the minimum number of polygons will
be used for the polygon columns.
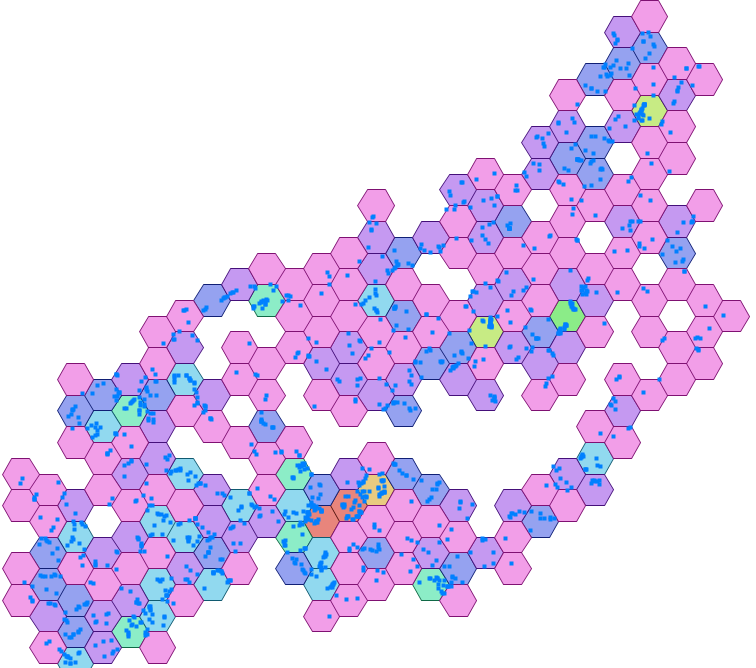
The following figure gives an example of created heagonal polygons.
It displays the number of points in the Excel spreadsheet which
fall under the individual polygons. You also set a value for
individual hexagon polygons. Here, you can use the Count
of points, or you can use a selected statistical function you can
apply to a selected column from your Excel table (For Example;
Average value).
Create Layer of Tyles
The penultimate map features you can create from Excel data
are Tiles – rectangular polygons. Their character is similar
to the previous hexagonal polygons; the only difference is
their geometry. Tiles are actually simple squares, similar
to rasters, and the only difference is that they are defined
in vector form. You will see additional adjustable parameters
when you select Tiles in the Feature Type combo-box.
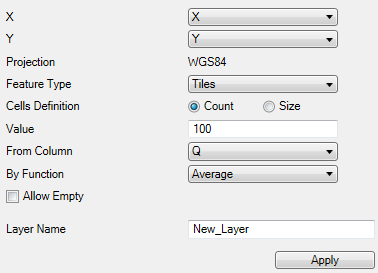
Explanation: The first two adjustable parameters define the
number of generated Tiles. You set whether you want to generate
tiles based on their minimum number (count) or size with the
Cells Definition radio button. Then you enter the desired value
in the Value text-box.
You set the Excel table column from which the values will be
processed similar to the hexagons, and you define the
statistical function you want to use. Generating Tiles has
more feature options than the previous feature types. Here,
you can set if you want tiles created in areas where there
are no points by using the Allow Empty check-box. The Tile
map layer example below did not allow empty tiles.